
# 关于ELK 对 mysql slow 慢日志报警
说下弄这个报警起因,之前一直想做这个事情,但是一直没时间就一拖再拖。终于出了一次事故。开发人员疏忽,使用全表查询语句。高峰期导致数据库读库game over。故此提上日程。
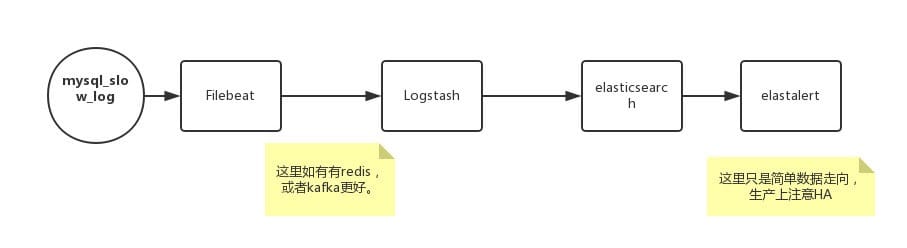
# 思路
# 基础环境及软件
- centos7
- filebeat
- logstash
- elasticsearch
- python
- elastalert
# 部署
由于官网这些都系都很齐全,这里就不过多介绍 可以参考我之前写的:
- filebeat 安装调试 (opens new window)
- elastalert 安装调试 (opens new window)
- elk 安装部署 (opens new window)
- ELK 部署测试 (opens new window)
# filebeat 相关配置
安装完成后,打开 filebeat.yml(RPM 安装在/etc/filebeat/filebeat.yml)
使用filebeat自带mysql模板
filebeat.config.modules:
  # Glob pattern for configuration loading
  path: ${path.config}/modules.d/*.yml

  # Set to true to enable config reloading
  reload.enabled: true
***对应如上修改就是将上一行修改false 为 true**

修改对应路径下的  /etc/filebeat/modules.d/mysql.yml.disabled 为  mysql.yml

添加mysql 慢日志路径

slowlog:
  enabled: true

  # Set custom paths for the log files. If left empty,
  # Filebeat will choose the paths depending on your OS.
  var.paths: ["/root/slow-queries.log"]
1
2
3
4
5
6
7
8
9
10
11
12
13
14
15
16
17
18
19
2
3
4
5
6
7
8
9
10
11
12
13
14
15
16
17
18
19
# logstash 相关配置
日志结构:
# User@Host: root[root] @  [127.0.0.1]
# Thread_id: 2678308  Schema: express  QC_hit: No
# Query_time: 11.785439  Lock_time: 0.000079  Rows_sent: 0  Rows_examined: 3856431
SET timestamp=1535630100;
SELECT * FROM  XXXX;
# Time: 180830  3:07:13
1
2
3
4
5
6
7
2
3
4
5
6
7
logstash.conf 配置如下:
input {
        beats {
                port => 5044
                #host => "IP"
       }

}
filter {
  grok {
    match => { "message" => "SELECT SLEEP" }
    add_tag => [ "sleep_drop" ]
    tag_on_failure => [] # prevent default _grokparsefailure tag on real records
  }
  if "sleep_drop" in [tags] {
    drop {}
  }
  ### 注意下面的 grok 正则需要对应上面日志进行调整,如果有不相同地方,需要进行对应调整。
  grok {
        match => ["message","(?m)^# User@Host: %{USER:user}\[[^\]]+\] @ (?:(?<clienthost>\S*) )?\[(?:%{IP:clientip})?\]\s*# Thread_id: %{NUMBER:Thread_id:int}\s+Schema: %{WORD:Schema}\s+QC_hit: %{WORD:QC_hit}\s*# Query_time: %{NUMBER:query_time:float}\s+Lock_time: %{NUMBER:lock_time:float}\s+Rows_sent: %{NUMBER:rows_sent:int}\s+Rows_examined: %{NUMBER:rows_examined:int}\s*(?:use %{DATA:database};\s*)?SET timestamp=%{NUMBER:timestamp};\s*(?<query>(?<action>\w+)\s+.*)\n# Time:.*$"]
        }


  date {
    match => [ "timestamp", "UNIX" ]
    remove_field => [ "timestamp" ]
  }
}
output {
        elasticsearch {
                hosts => "IP:9200"
                index => "mysql-slow-%{+YYYY.MM.dd}"
        }
}
1
2
3
4
5
6
7
8
9
10
11
12
13
14
15
16
17
18
19
20
21
22
23
24
25
26
27
28
29
30
31
32
33
2
3
4
5
6
7
8
9
10
11
12
13
14
15
16
17
18
19
20
21
22
23
24
25
26
27
28
29
30
31
32
33
# elastalert rules 调整
filter:
- query_string:
    query: "query_time: >=0.5"  ## mysql slow  大于0.5s 报警。
    ## kibana   Query DSL 语法
1
2
3
4
2
3
4
强烈说明 如果对如上配置或者不明白,一定要先理解 logstash 、elastalert、 kibana dsl语法。
# 同理 mongodb也可以做
logstash相关配置
filters {
  grok {
    type => "mongodb"
    pattern => [ "%{DATA:mongo_ts} \[%{DATA:mongo_conn}\]? %{DATA:mongo_type} %{GREEDYDATA:mongo_message}" ]
  }
  mutate {
    type => "mongodb"
    replace => [ "@message", "%{mongo_message}" ]
  }
  grok {
    type => "mongodb"
    match => [ "mongodb_conn", "query|command|getmore" ] # list of mongo commands with k:v pairs
    pattern => [ "%{DATA:mongo_collection} %{GREEDYDATA:mongo_details} %{NUMBER:mongo_time:int}ms" ]
  }
1
2
3
4
5
6
7
8
9
10
11
12
13
14
2
3
4
5
6
7
8
9
10
11
12
13
14